What MALA does best
The three that matter most — then everything else under the hood.
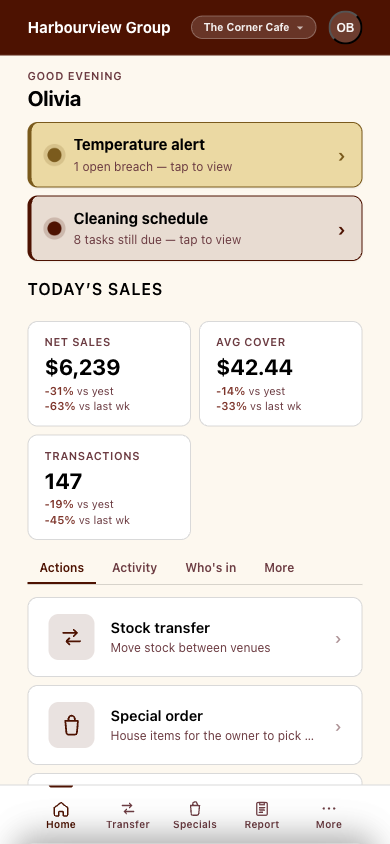
Staff app
Run the floor from a phone
Your team logs end-of-day takings, ticks off cleaning, raises incidents and requests stock transfers from a wall tablet or their own phone — and it all flows straight to the owner. Live front-of-house bonus targets keep the team pushing.
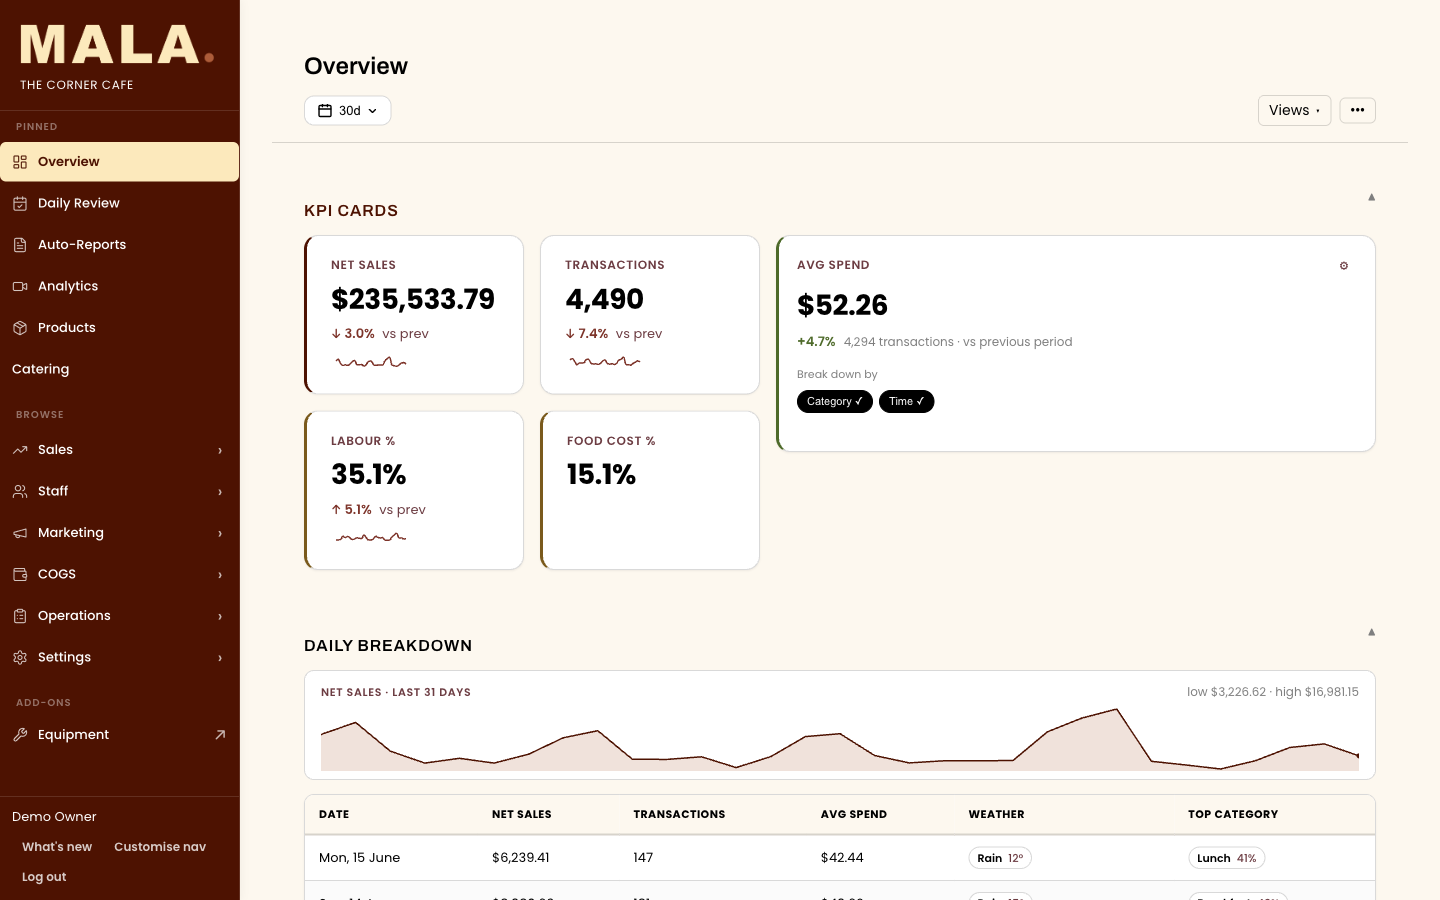
One dashboard
Every venue's numbers in one place
MALA pulls POS, rosters, suppliers and accounting into one owner-facing dashboard. See turnover, labour % and food cost % for a single venue or the whole group — without logging into five separate tools.
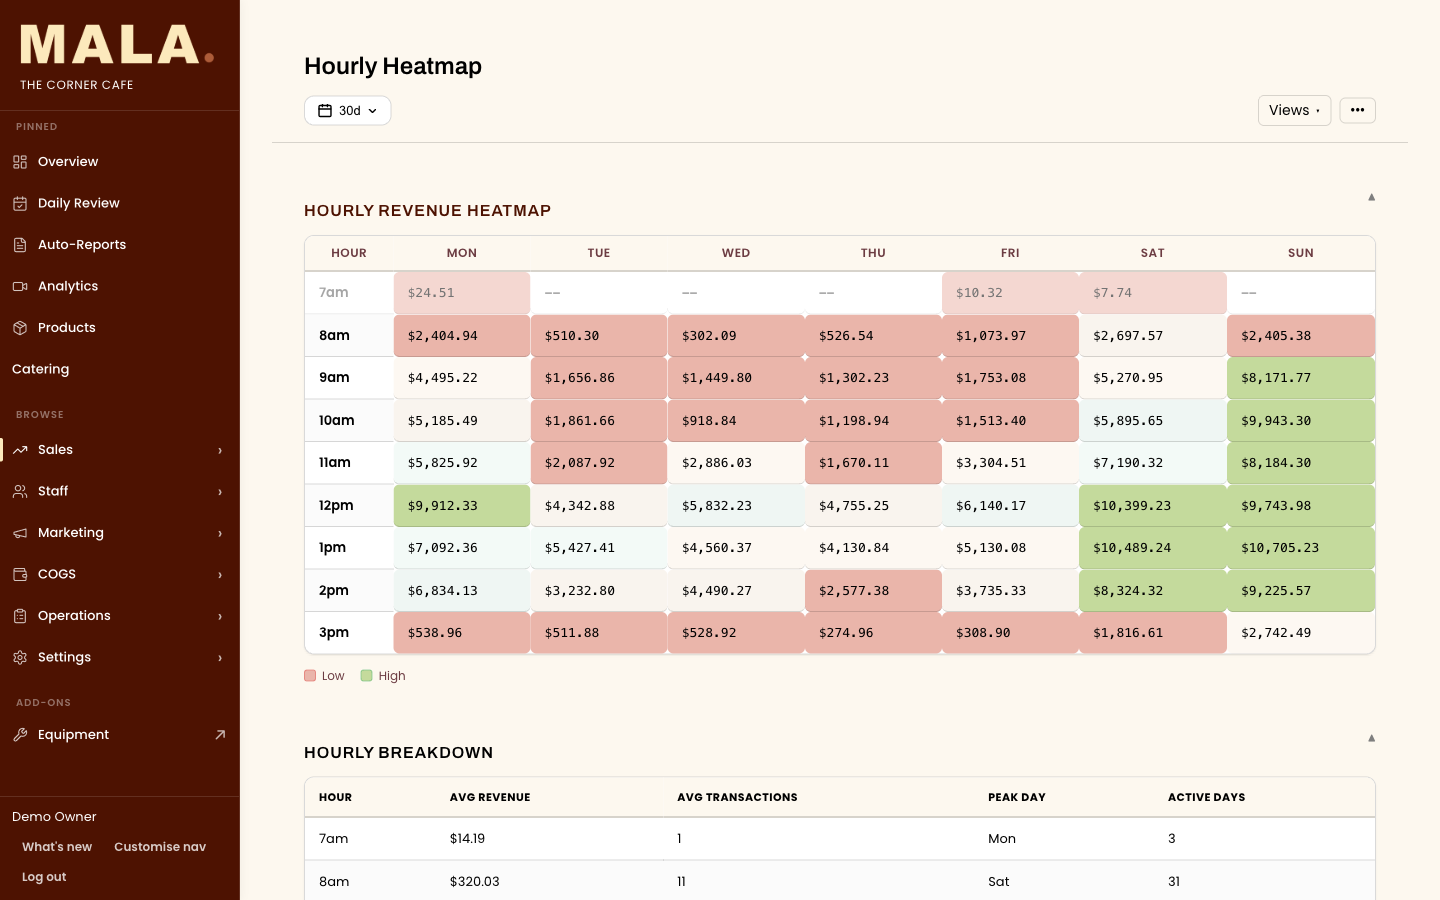
Unparalleled insights
The insights nobody else gives you
Hourly revenue heatmaps, weather correlation, event-day lift, theoretical-vs-actual food cost variance and per-venue KPI targets with colour-coded variance everywhere — the detail that keeps a venue honest.
Everything else under the hood
Hourly heatmap
Revenue by hour across the week, so you staff to the actual peaks.
Weather correlation
Overlay rain and temperature on sales to separate the weather from the operation.
Event tagging
Tag special days like UFC or Mother's Day and measure their real lift.
Closing efficiency
Track who closes, how long it takes and the variance.
FOH sales-bonus tracker
Daily front-of-house targets and staff bonuses shown live on the kiosk.
BOH dashboards
Wall-mounted back-of-house displays with custom widgets and layout.
Automated email reports
Scheduled daily and weekly reports, configured once and sent to whoever needs them.
KPI targets & variance
Per-venue targets for revenue, labour %, COGS % and tips, with colour-coded variance everywhere.
Notifications & alert groups
Email, SMS and WhatsApp alerts for incidents, transfers and EOD reports, sent to reusable recipient groups.
API keys
Programmatic access for your own integrations and reporting.
Order channels & payments
Sales split by dine-in, takeaway and delivery, and by payment method including tips.
Item mix & modifier tracking
Top items by revenue, plus upsell attachment rate and the revenue each modifier drives.
Table & customer analytics
Earnings per hour by table, plus visit frequency and spend trends per customer.
Discount tracking
Discount usage by staff member and its revenue impact.
Reviews & messaging
Google review sentiment with AI-drafted replies, plus WhatsApp and SMS to staff and customers — sitting beside the sales numbers that explain them.
On the roadmap
Period & venue comparison Soon
This week vs last, year-over-year, and side-by-side venue benchmarking.
Forecasts Soon
Revenue and cover predictions from history, weather and holidays.
Rostering & wage heatmap Soon
Pull live rosters, drag-drop shifts, and see wage spend against sales hour by hour.
COGS overview Soon
Restoke purchasing, food cost % and accounting bills rolled into one view.